Campaigns spent a lot of money on T-shirts, lawn signs, buttons, stickers, palm sheets and other materials. If you’re lucky, potential voters will remember the URL and check out their candidate when they get home.
Unfortunately, that’s an unrealistic dream. Here’s why:
- American voters, conservatively, see thousands of marketing messages every day. Even presidential campaigns can’t compete with all that noise.
- While your campaign materials are meant to elicit interest when it’s at its peak, websites have little chance of converting that voter into a supporter, because these interests wane quickly.
- If potential voters immediately key in a URL on their smart phone, nearly 100% of political campaigns have not optimized their websites for mobile.
With these issues, gaining name recognition will be challenging as well.
If you’re campaign has a MACE score (http://polimobile.com/mace) of over 50%, you’re wasting your hard fundraised campaign dollars on materials that don’t convert voters and to supporters.
Here are some ideas that we’ve seen work:
- Both Rock the Vote and Mitt Romney’s campaign have T-shirts that feature QR codes. These types of barcodes route mobile users to mobile optimized websites.
- Scott Brown’s 2010 senate campaign prominently featured opt-in messages are their rally and lawn signs.
- And taking a tip from the business world, Geico adds QR codes to the outside of their envelopes to streamline the information process. Imagine that on your next fundraising ask.
There are hundreds of ways of incorporating mobile into your campaign efforts. It easily piggybacks off of what you’re already doing, and it captures the interests of the potential supporter when it’s at its highest.
Not sure how mobile can be used in your campaign? Contact us and we can help you brainstorm ideas on how to turn potential voters and ardent supporters using mobile.

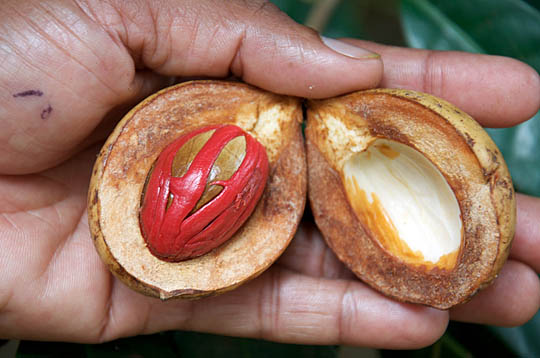
Not the spice, but an easy equation.
Many are stuck when it comes to mobile. They’re confused on whether mobile tools fit within their operations and communications mix, and how they will impact registered voters.
It’s a matter of simple math for campaigns answer this question. The Mobile Affect on Campaign Efficiency (MACE) percentage shows how many registered voters will be impacted by mobile tools.
Step 1: Collect Your District’s Census Data
This information is readily available online or from the Secretary of State website.
Step 2: Combine the %s of Residents Ages 15-34 (Y)
While 15-17 year-olds can’t vote, we’re looking for general data trends. This age range encompasses the millennial generation — the heaviest consumers of mobile messaging, data and apps as a generation. They’ve also never owned a landline and largely ignore email outside of work.
Step 3: Add Up the Population %s of Communities of Color (C)
Persons of color are 40-60% more likely to have a mobile phone as their only piece of personal technology. This audience is more likely to use a feature phone and be on a prepaid plan, and use their mobile device to do more than the general population.
Step 4: Add the % of Households with Kids under the Age of 18 (K)
Children drive mobile usage, whether they are direct consumers or indirect beneficiaries. Families consume more minutes and data, on average, than an equal number of individuals. And children between the ages of 13-18 consume the most of any comparable age group.
Step 5: Combine %s & Multiply by the Urban Population % (U)
Population density plays a significant role in the efficacy of mobile tools. The more rural the population is, the less the availability of mobile data access, content providers and other factors.
Step 6: Add or Deduct the CPVI from the Combined % (CPVI)
Factor the Cook PVI score as a percentage. If the district has a CPVI of D+19 or R+12, add 19% or subtract 12% respectively. The stronger the opponent’s party, the less effective mobile campaigns will be. Mobile has a greatest impact on GOTV efforts when a district also has a high Democratic score. With it, mobile can become one of the most cost-effective and labor efficient tools to drive voters to the polls.
Here’s the formula to calculate a MACE percentage:
U(Y+C+K)+CPVI=MACE
Let’s test by calculating MACE for Minnesota’s 5th and 7th US Congressional Districts, one encompasses Minneapolis and some inner-ring suburbs and the other the largely rural Northwest corner of Minnesota.
5th US Congressional District:
1.00(0.35+0.28+0.23)+0.23 = 109% of Registered Voters
It’s no surprise that this densely populated district is the youngest and most racially diverse in the Minnesota, and a progressive stronghold. With MACE that exceeds registered voters, there’s ample room to rally new voters and focus on GOTV in the Fall — a strategy that the Ellison Campaign is following. Mobile tools can have a dramatic impact on their efforts.
7th US Congressional District:
0.34(0.25+0.06+0.27)-0.05 = 15% of Registered Voters
This sparsely populated congressional district seems to be the exact opposite in a demographic sense. The area is dramatically older, the least racially diverse in the state and leans to the GOP. Unless it’s an exceptionally close race, mobile tools will have small impact on the electorate.
As with any calculation, MACE is not perfect. Many question the efficacy of the Cook PVI. But this percentage will show campaigns the potential impact of mobile tools on registered voters.

